Global Heatwave Visualisation

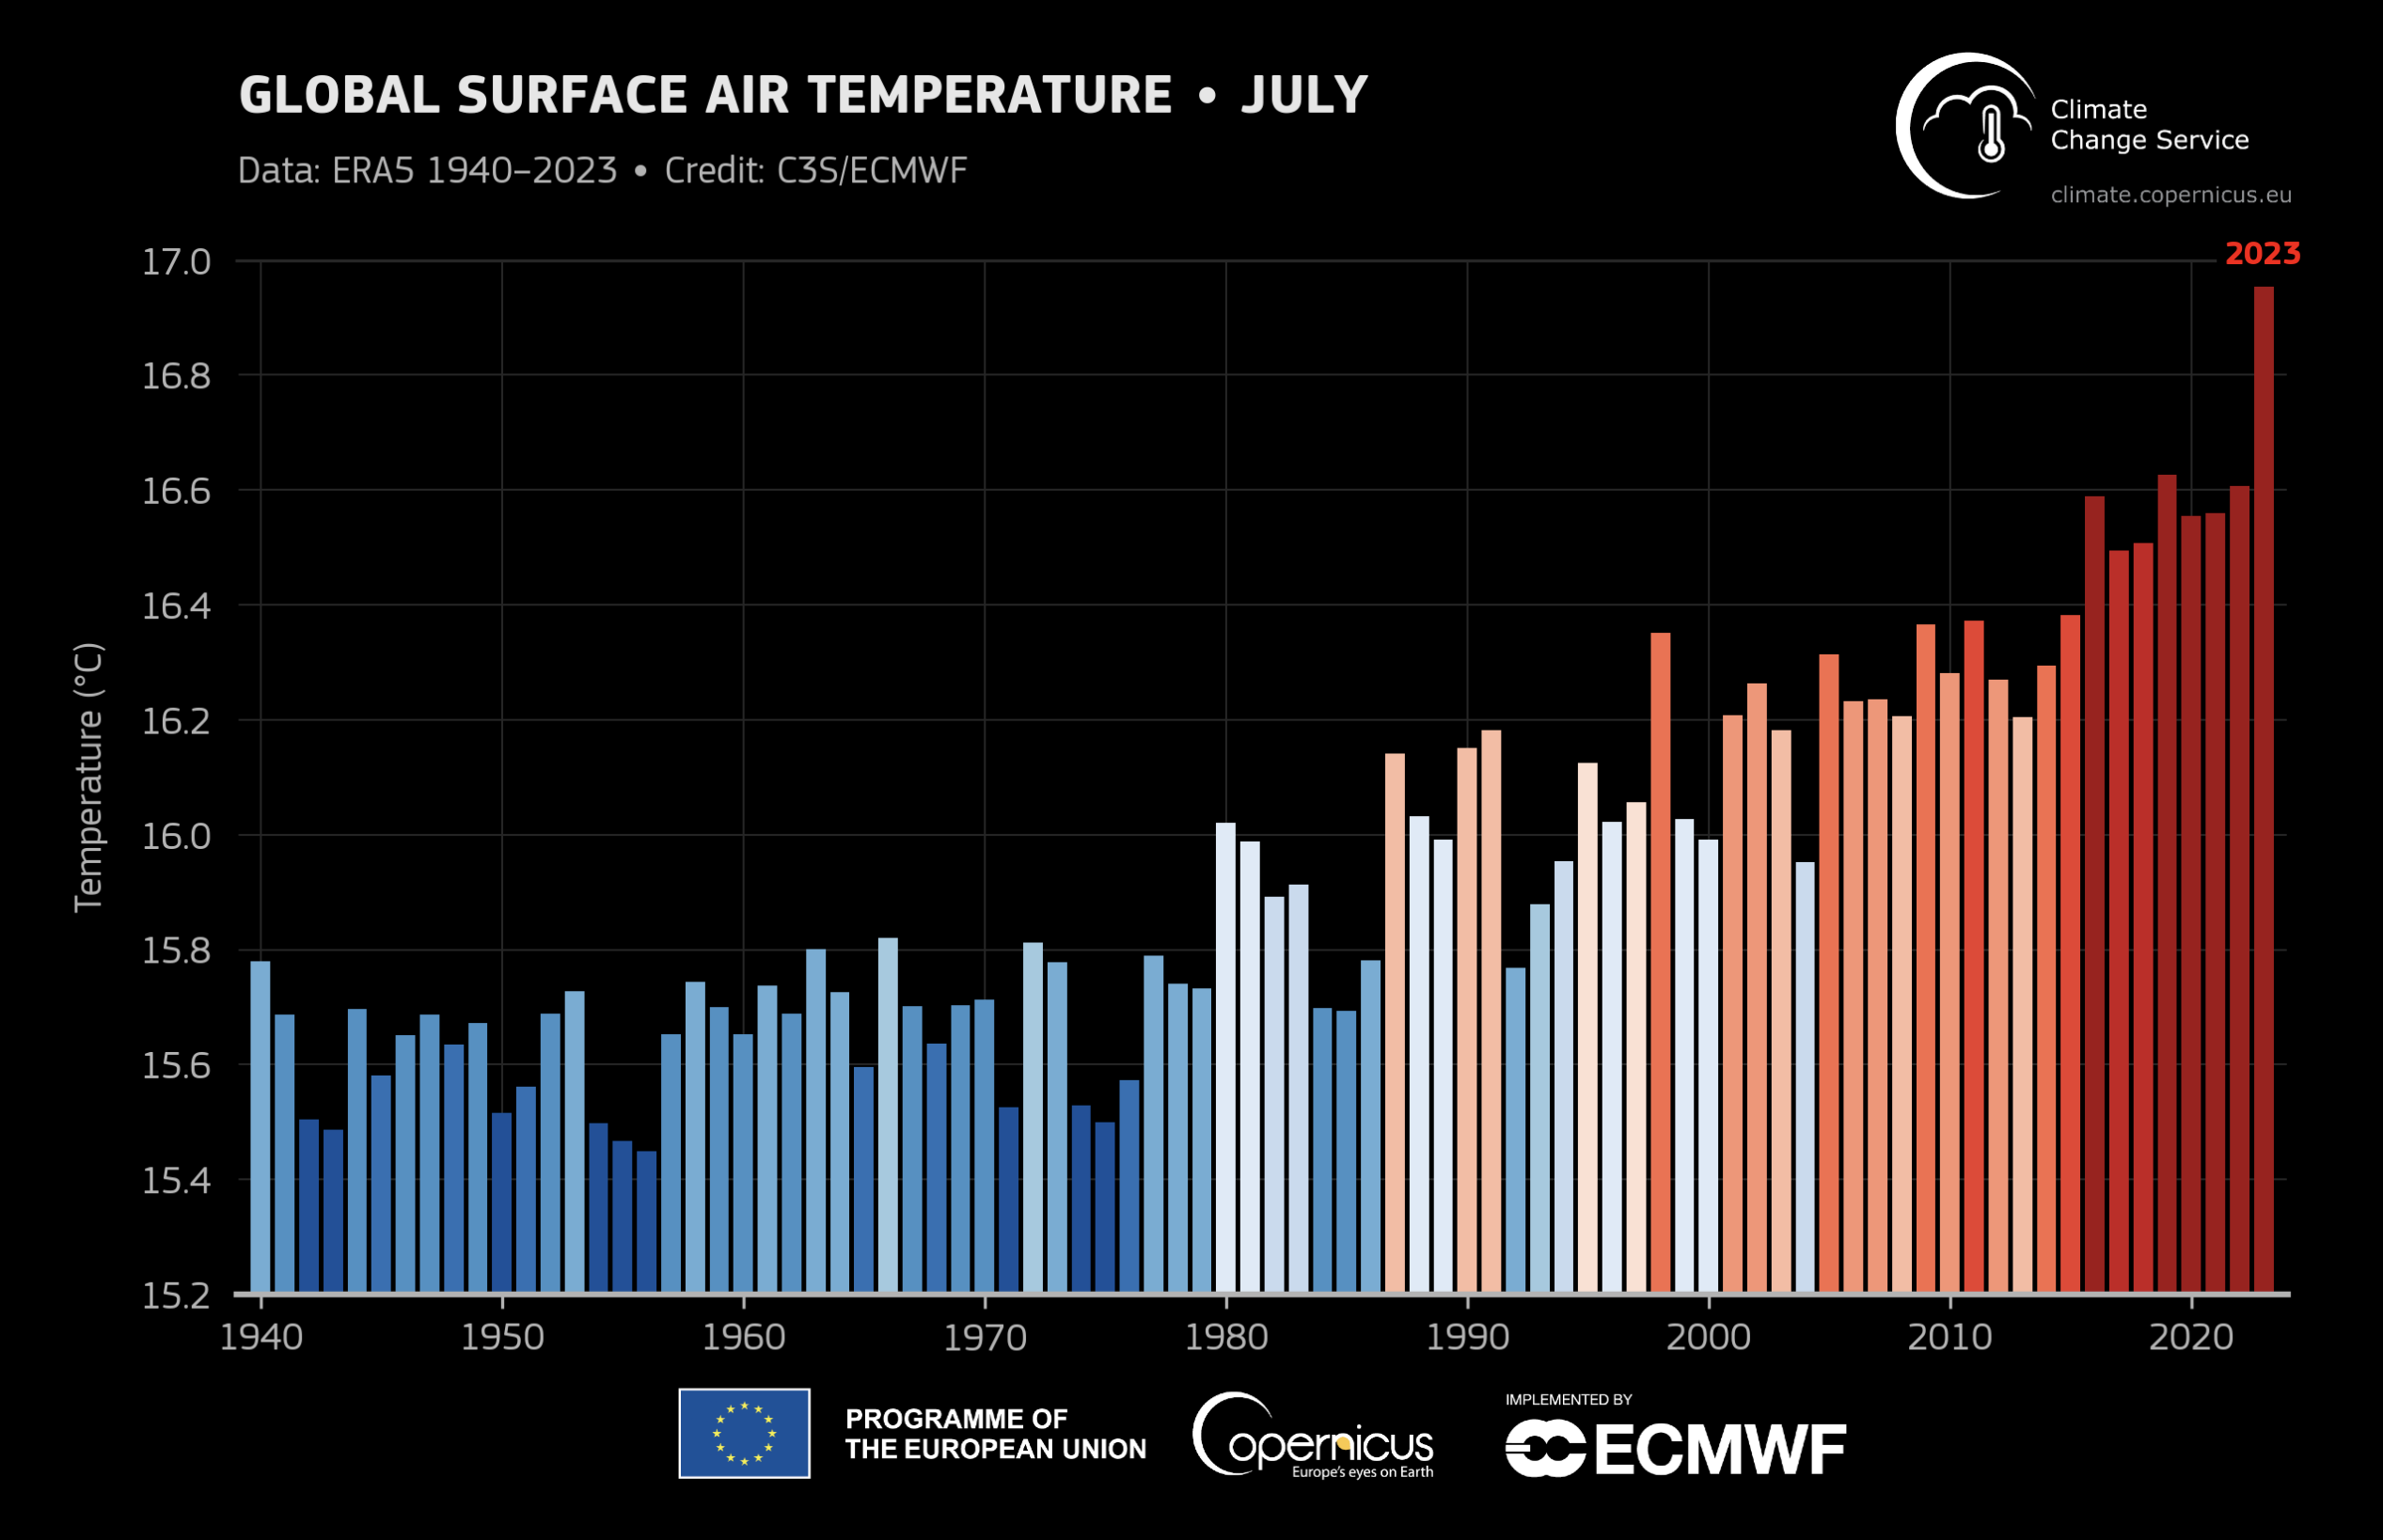
July 2023 was the warmest month on record (Fig. 1) with concurrent heatwaves around the globe (see the Copernicus Climate Change Service report for more detail). I wanted to use my Climate Archive engine to visualise the global pattern of the heat waves raging around the globe and link them to mainstream weather and climate news of this truly extreme month.
For this, I used daily near-surface air temperatures (2m) from the ERA5 reanalysis produced by ECMWF. I calculated anomalies compared to the long-term mean (1991-2020) and only focused on significantly warmer than normal temperatures. I followed the UK MetOffice heatwave definition to track the occurence of heatwaves. Wherever a heatwave occured over the course of July 2023, the background color of the map switches from gray to black. This gives the effect of a scratch map that gets slowly revealed over the whole month and illustrates that more than 50% of the global population experienced at least one heatwave during July 2023!
Links to the source data and all analysis code (Python) is available on GitHub. The final visualisation is shown below and is also accessible in an interactive version at era5.climatearchive.org.
Enjoy Reading This Article?
Here are some more articles you might like to read next: